Stop Flying Blind at Retail
Traditional data is weeks old and too high-level. From pricing to execution, Thrivvy gives brands and retailers the real-time, store-level pricing, promotions, and assortment insights that drive powerful market intelligence.
Thrivvy empowers brands and retailers with fully shareable competitive data from every store.
In a Nutshell
We provide access to millions of grocery and retail pricing records from every store at big and small retailers. Our proprietary technology platform allows you to obtain – and share – hyperlocal pricing, promotions, and assortment insights that drive powerful market intelligence.
Weekly Observations
Collected across hundreds of retail locations
Product Coverage
Complete visibility across the retailer's entire catalog
Data Updates
Fresh insights for timely decision-making
Data Shareable
Fully shareable data for collaborative decision-making
Built for emerging CPG brands who are tired of flying blind at retail.
Real-time Data Collection
Access store-level data that's collected weekly, giving you visibility into pricing, promotions, and assortment that traditional syndicated data can't provide.
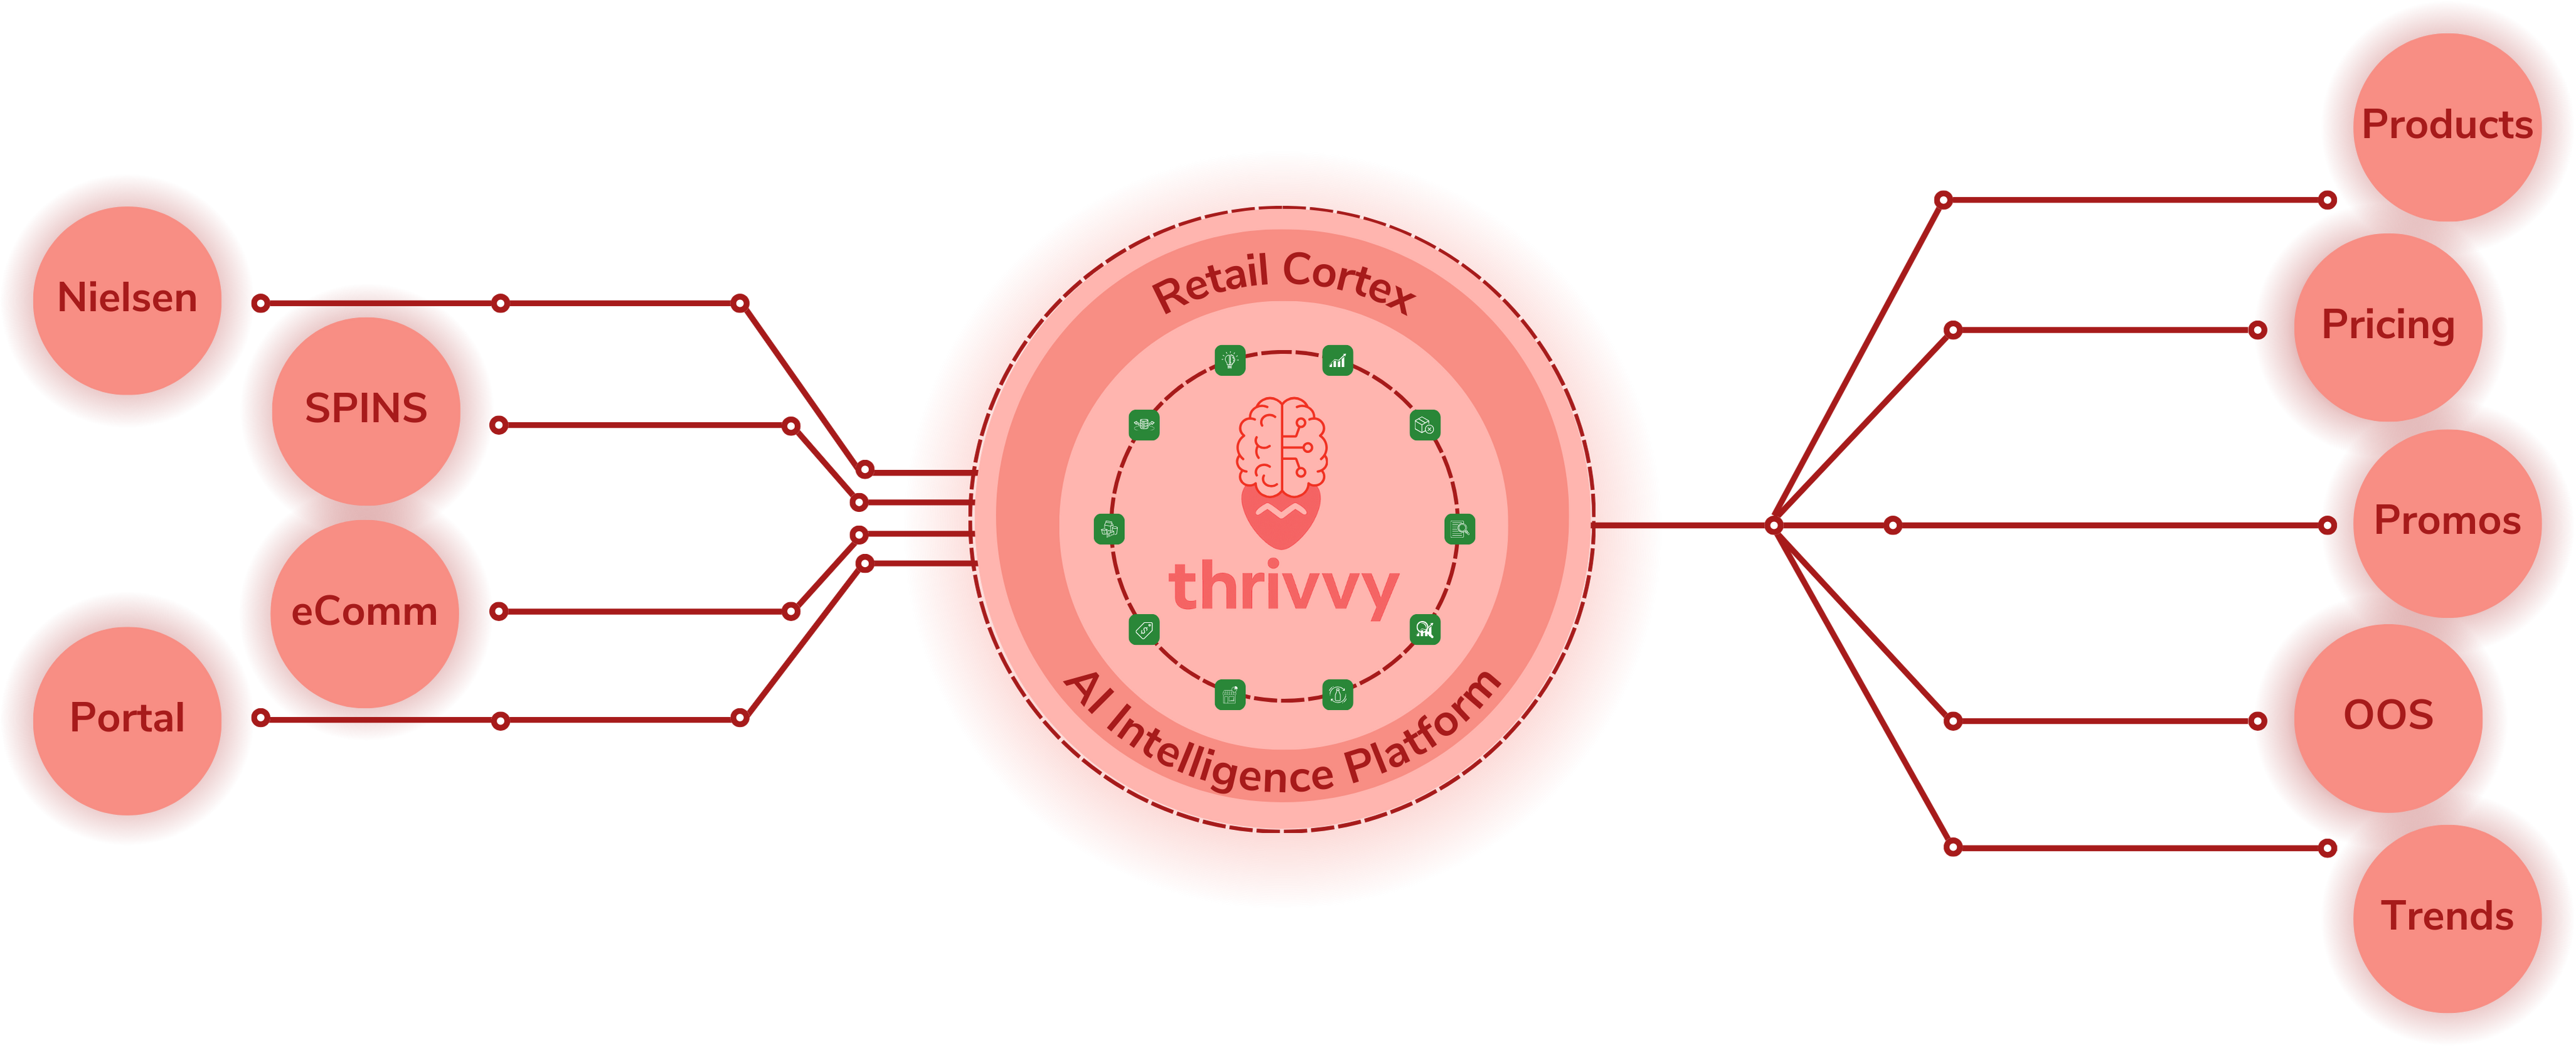
Data Harmonization
Our platform seamlessly integrates and harmonizes data from multiple sources, creating a single source of truth for your retail intelligence.
Fully Shareable Insights
Unlike traditional data providers, Thrivvy's data is 100% shareable, enabling collaborative decision-making with retailers and partners.
Actionable Intelligence
Transform data into easy-to-understand visualizations and analyses that help you identify opportunities and address issues before they impact sales.
Speed to Insight
Thrivvy delivers insights 4x faster than sales data, allowing you to respond to market changes before your competitors even know they happened.
Implementation Time
Get up and running in days, not weeks or months, with our streamlined onboarding process and intuitive platform design.
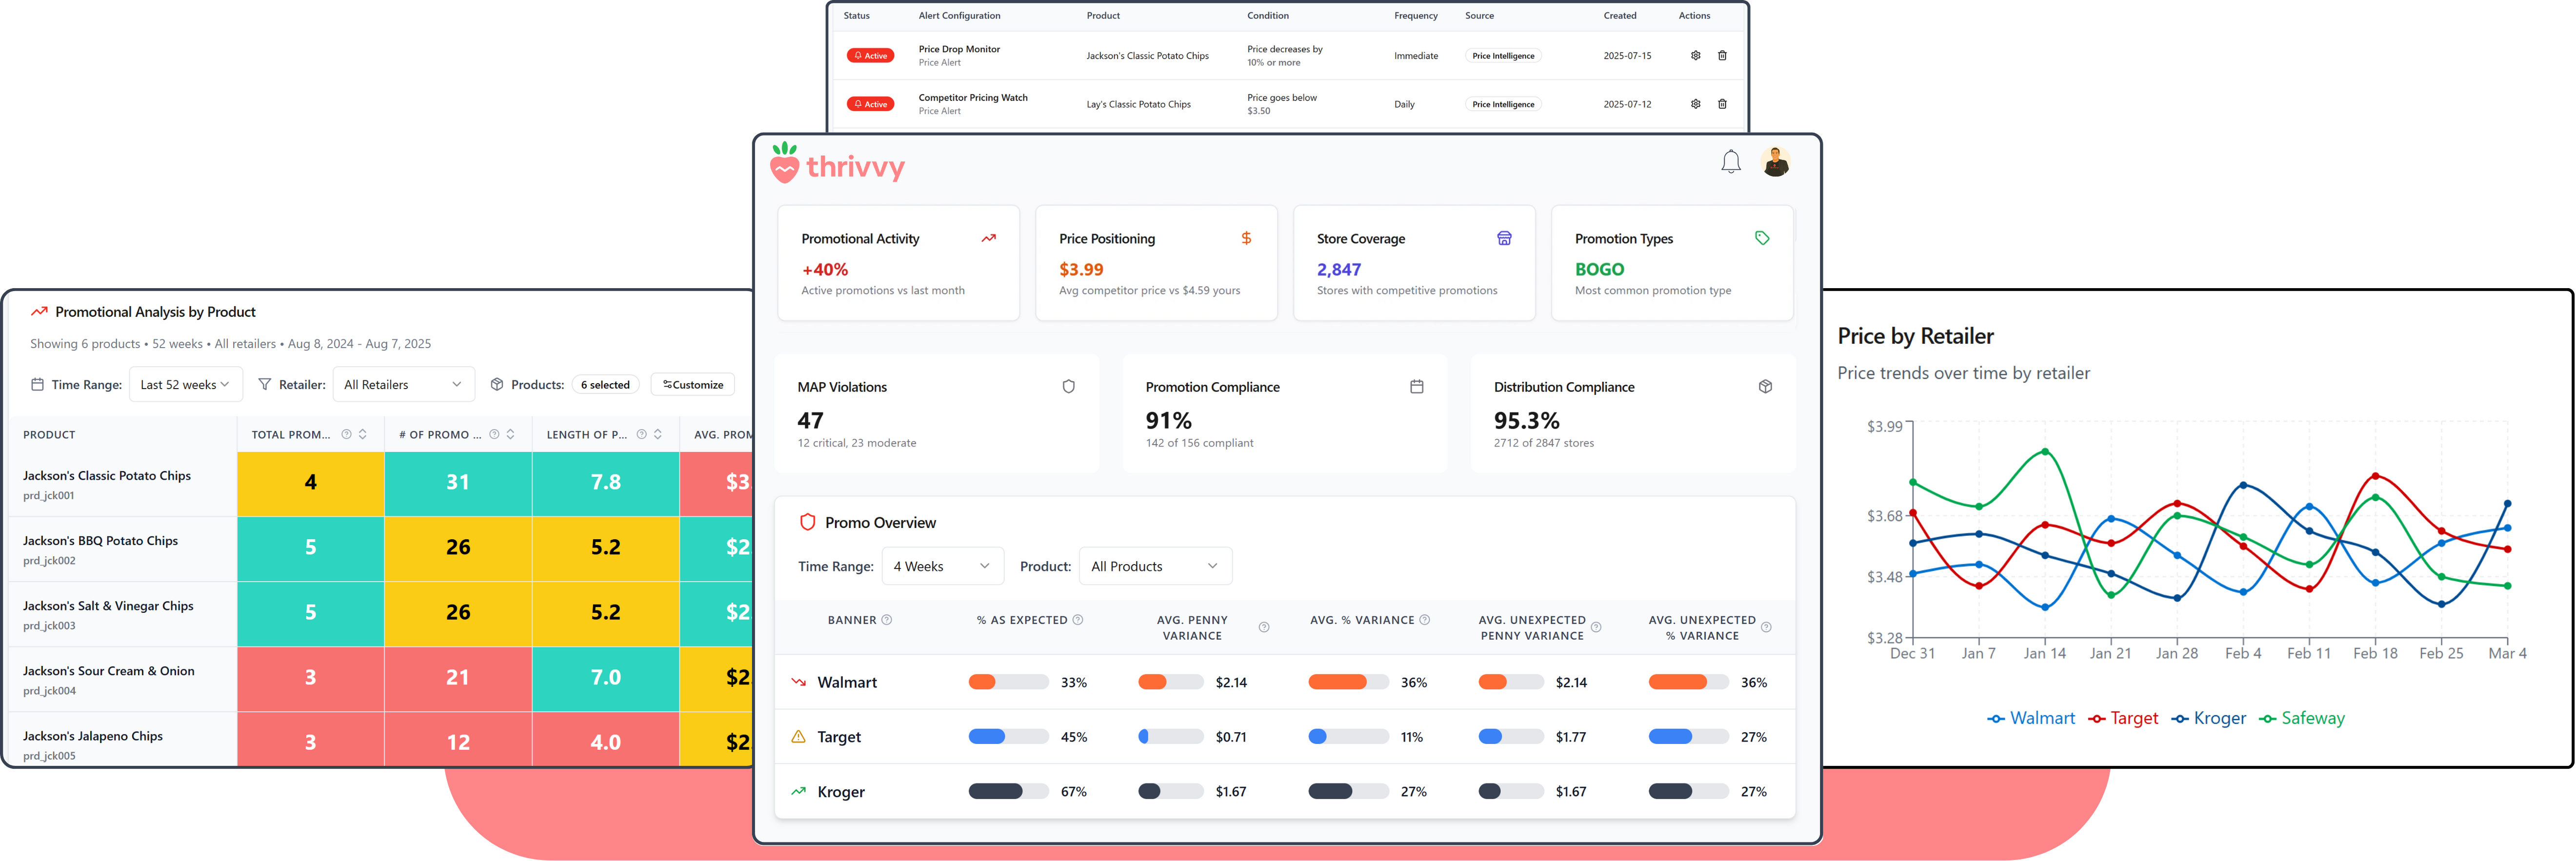
Turning Complex Data into Instant Insights
Thrivvy collects fully shareable store-level data and harmonizes it with syndicated sources to provide the insights CPG companies need. Our platform combines retail intelligence with your existing data, using AI-powered analytics to deliver actionable insights that drive growth and provide unmatched productivity.
Solution Suites
Traditional syndicated data leaves you weeks behind — and in the dark. Thrivvy puts real-time, store-level pricing, availability, and promo insights in your hands so you can act fast and protect every dollar you spend on retail execution.
Compliance Monitoring
Track and improve in-store execution with real-time monitoring of MAP compliance, out-of-stock situations, and on-shelf availability.
Learn more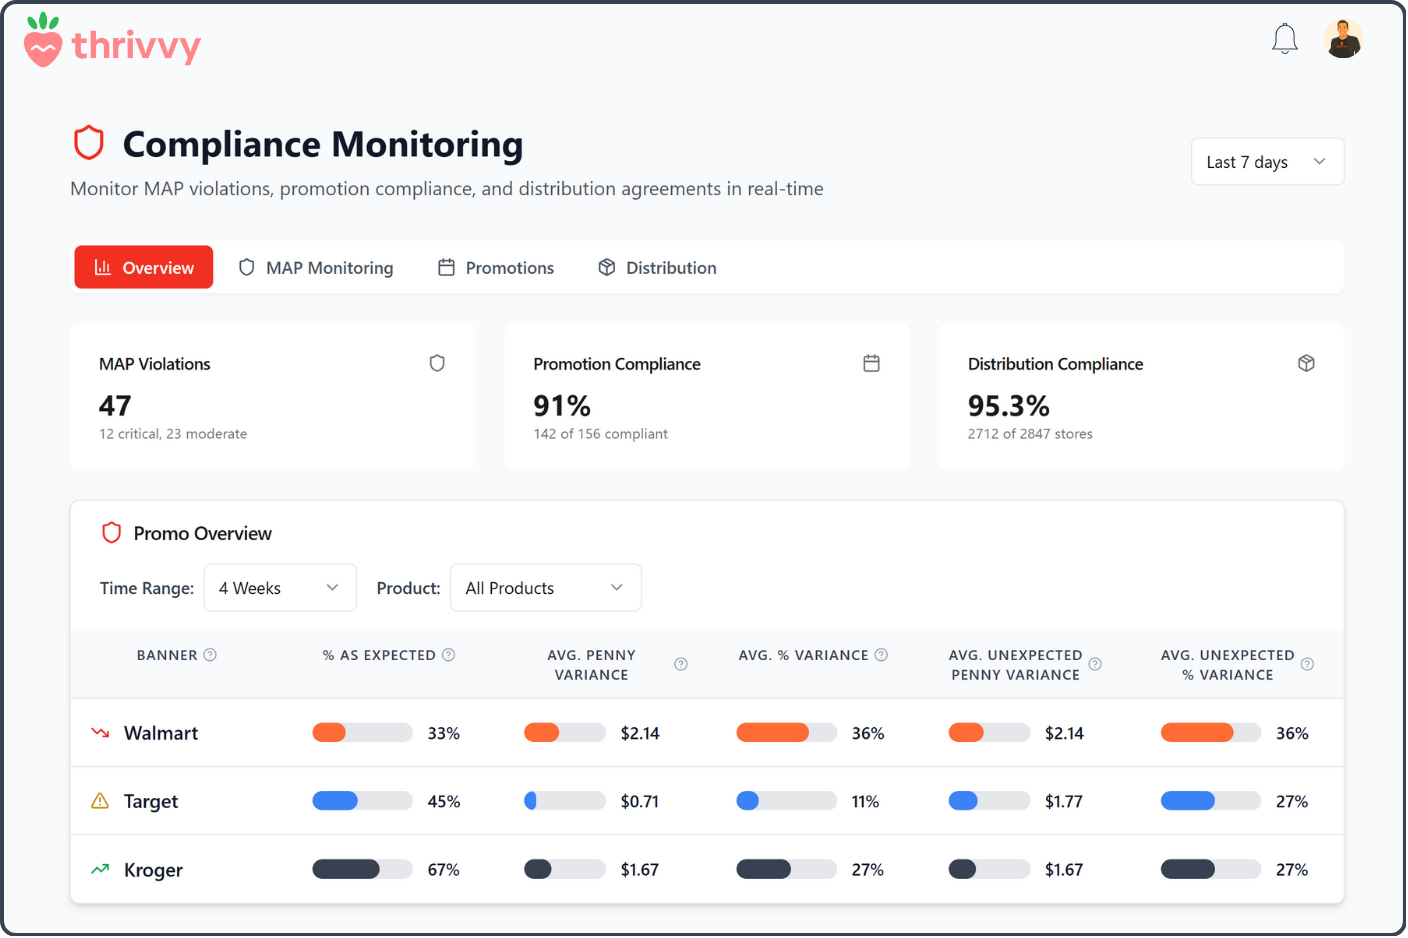
Price Intelligence
Monitor and optimize pricing strategies with real-time competitive insights and automated price tracking across all retail channels.
Learn more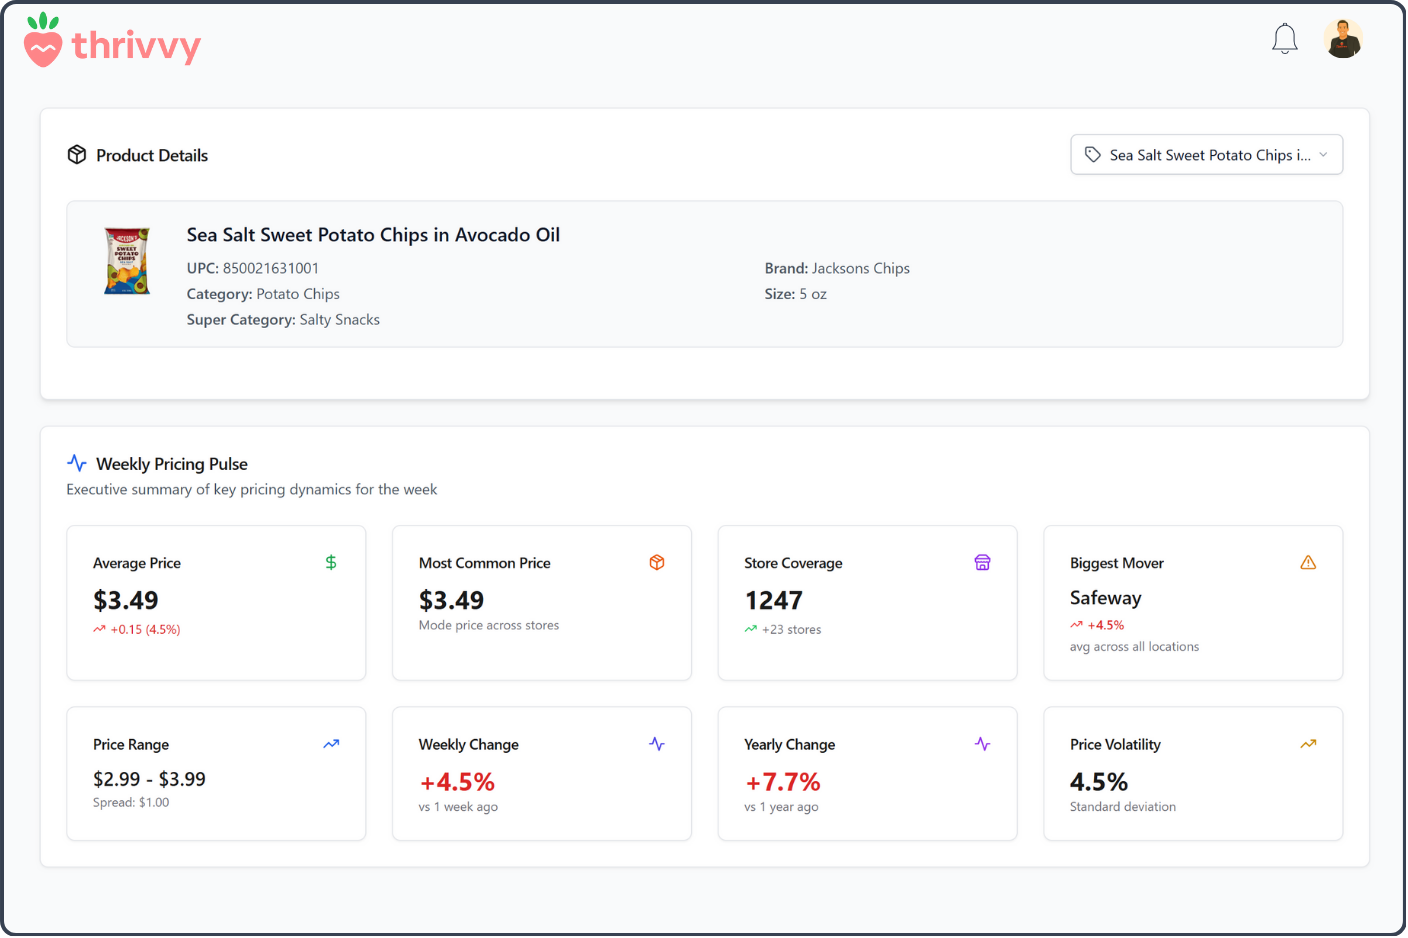
Promotion Optimization
Maximize ROI on promotional activities with real-time tracking and optimization of promotional performance across all channels.
Learn more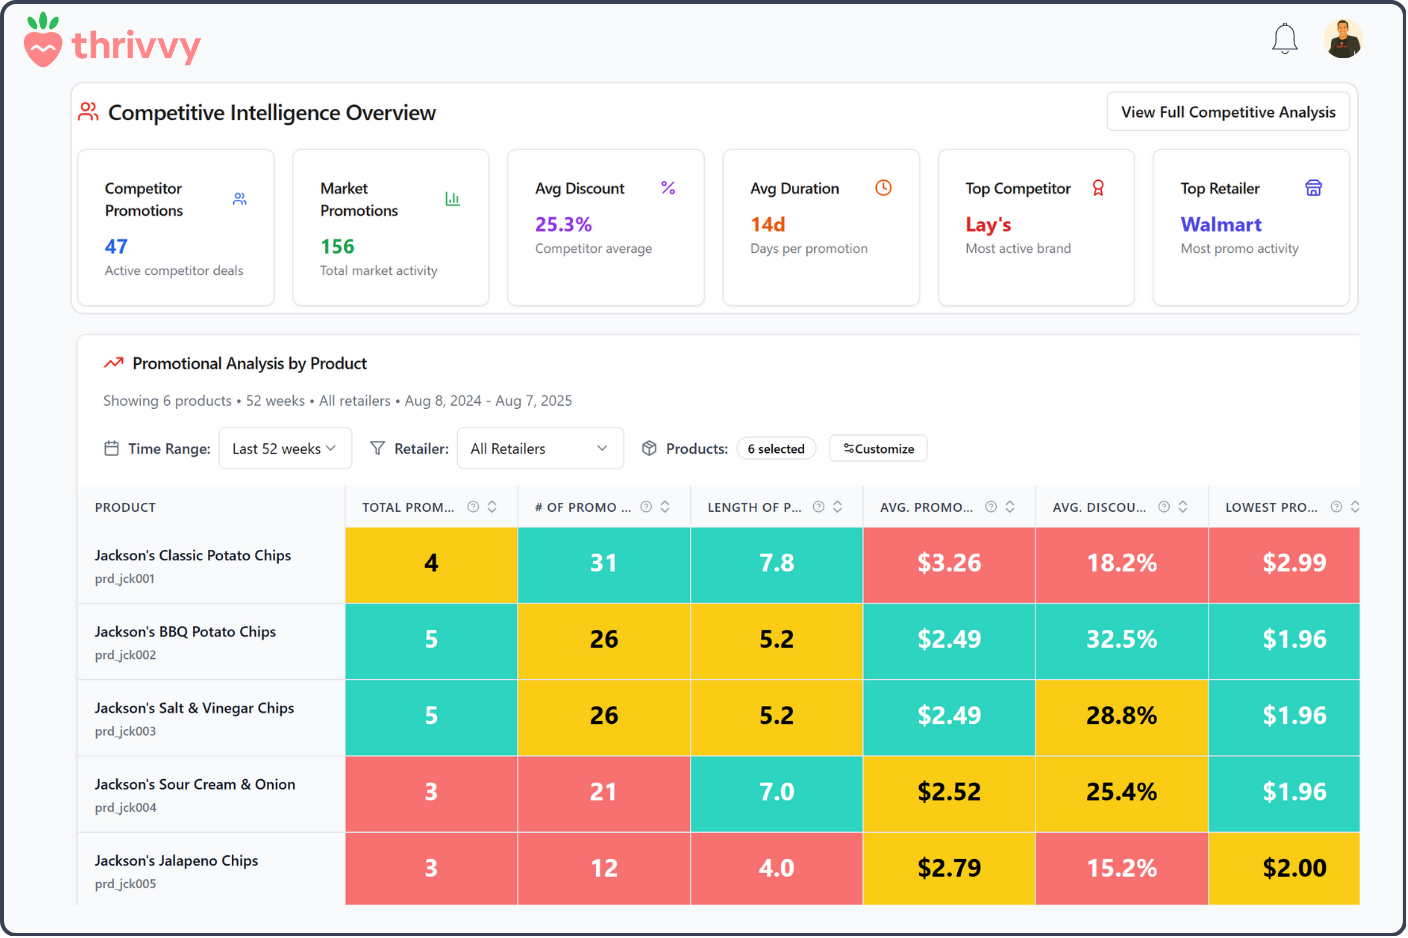
Assortment Optimization
Optimize product mix and placement with data-driven insights into product performance, market gaps, and distribution opportunities.
Learn more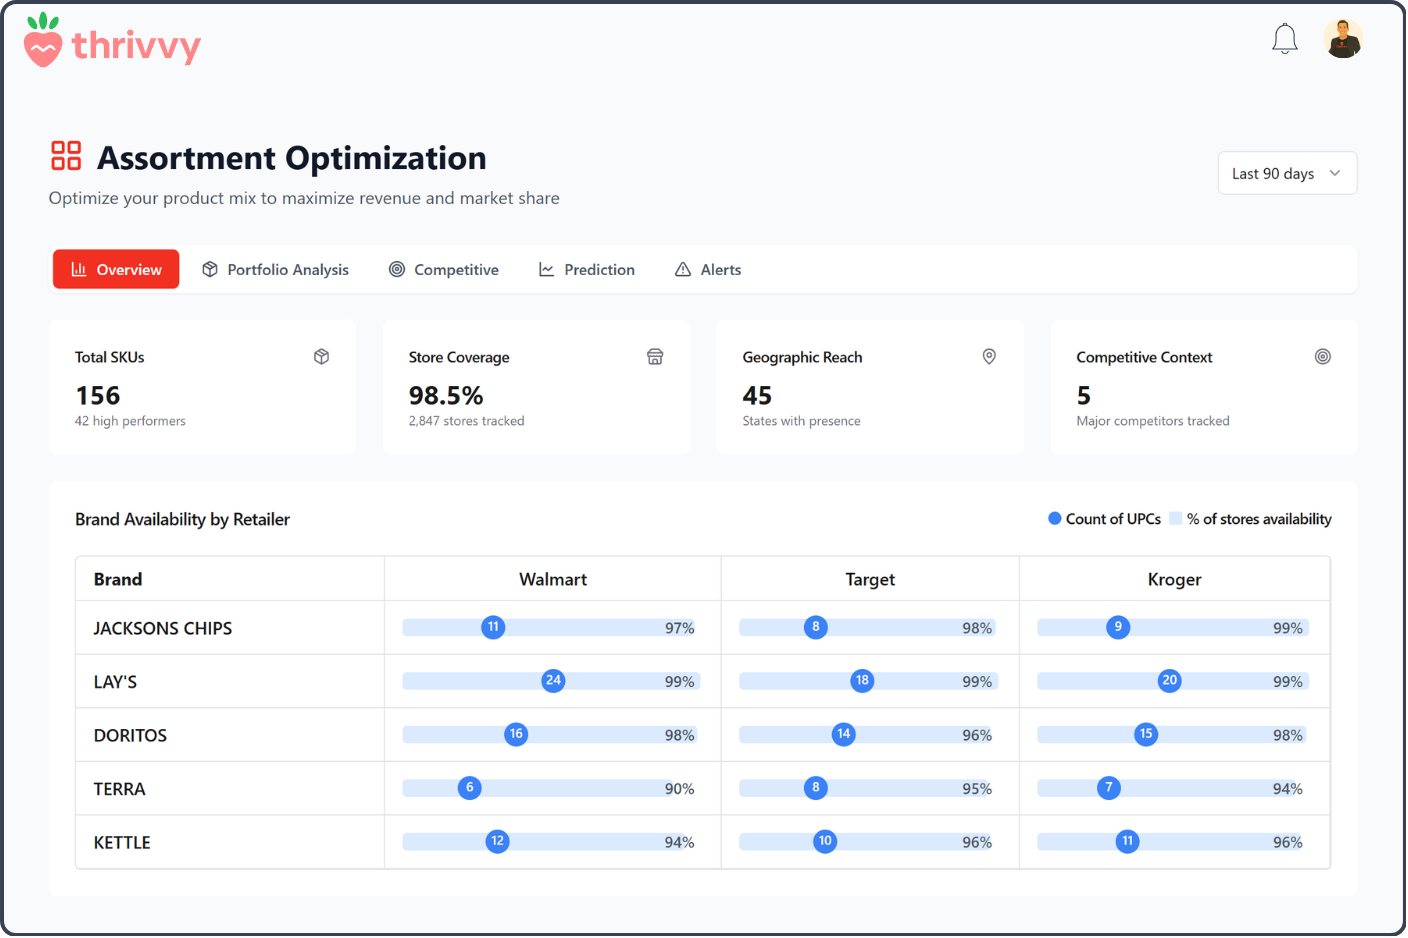
Retail Innovation
Stay ahead with cutting-edge retail solutions that help you identify emerging trends, track competitive innovations, and drive growth.
Learn more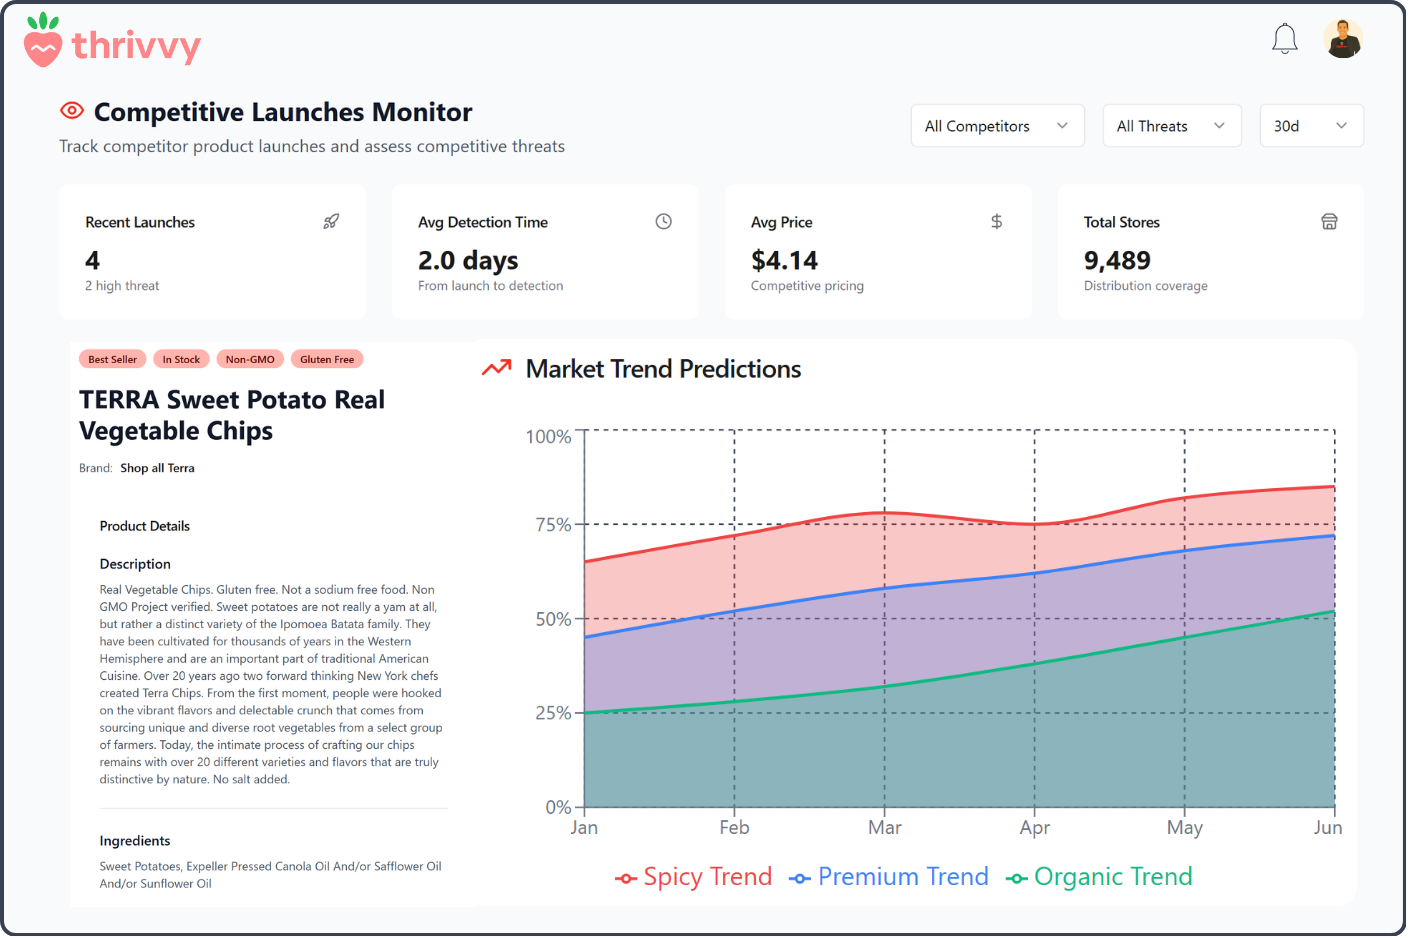
Visualize Your Data With A Library Of Tools
Familiar CPG visualizations, augmented with AI-powered insights and real-time data
Quad Week Comparison
Shows how your product is performing in a specific market over four consecutive time periods.
Sales Decomposition
Forecasts a product's sales growth or decline based on key contributing factors.
Period Comparison
Compares a product's performance across specified time periods to identify trends.
Change vs Year Ago
Compares the year-over-year change in a single metric across multiple products or markets.
Side-by-Side Comparison
Presents comprehensive metrics to determine the relative strength of two products or markets.
Weekly Trends
Shows the weekly performance of multiple products in one market, or one product in multiple markets.
Heatmap
Highlights products/markets that are above or below specific performance thresholds.
Share Comparison
Compares product shares within a competitive set or market shares across multiple retailers.
Sign Up for the Waitlist
Be among the first to access our real-time, hyper-local product data platform when we launch.